The mule deer is arguably the most iconic species in western North America. On top of its iconic status and increased exclusivity of obtaining mule deer tags, the species carries a lot of attention throughout the hunting community. And with that comes criticism that mule deer populations and their habitats are on a continual decline. One of the most direct metrics hunters use when concluding the status of mule deer is their personal experiences, and that can sometimes sway the perception of how the overall populations are trending. In the attempt to eliminate individual perceptions, this article will focus on the overall mule deer population status and trends across the Lower 48.
Mule Deer Populations
State wildlife agencies are balancing the demands between ample hunting opportunity and management for upper age class deer while sustaining mule deer populations for future generations[1]. The management objectives vary for many different reasons and populations will change and fluctuate based on hard winters, droughts, changes in habitat, etc. Some of the most useful management data points used by wildlife biologists to adapt to those fluctuations are the population trends, population abundance, and buck to doe (B:D) ratio to name a few. Perhaps the most useful metric hunters would want to pay attention to when picking units is the B:D ratio. This is the most useful in determining whether a unit is managed for older bucks or opportunity.
The Data
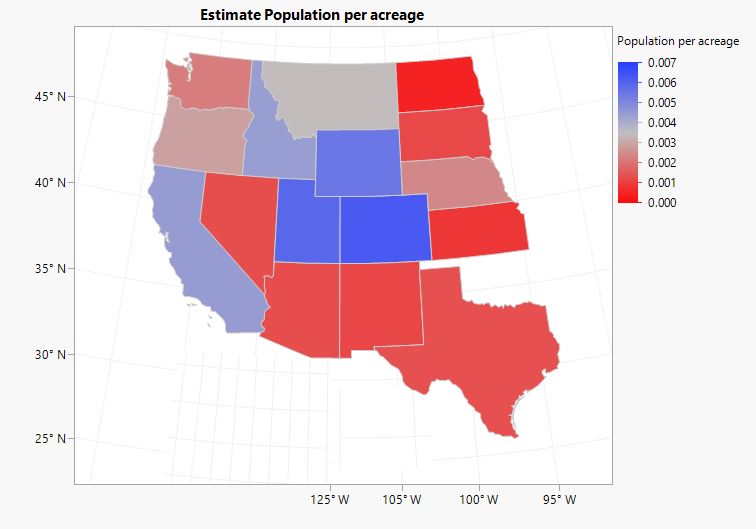
Now let’s dig into the data on how mule deer populations are doing as a whole! First, to illustrate the range-wide status of mule deer in the Intermountain West, I mapped the estimated mule deer population per acre for each state shown in Figure 1. This nicely shows the most abundant mule deer states are (in no particular order): California, Colorado, Idaho, Utah, and Wyoming. Perhaps not surprisingly, the Eastern-most states(the Dakotas, Nebraska, Kansas) and the more arid states (Nevada, Arizona, New Mexico, and Texas) show the least abundance, except for Oregon and Washington. I think most hunters would argue that this illustration is consistent with what is seen in the field.
Quality Metric Parameters
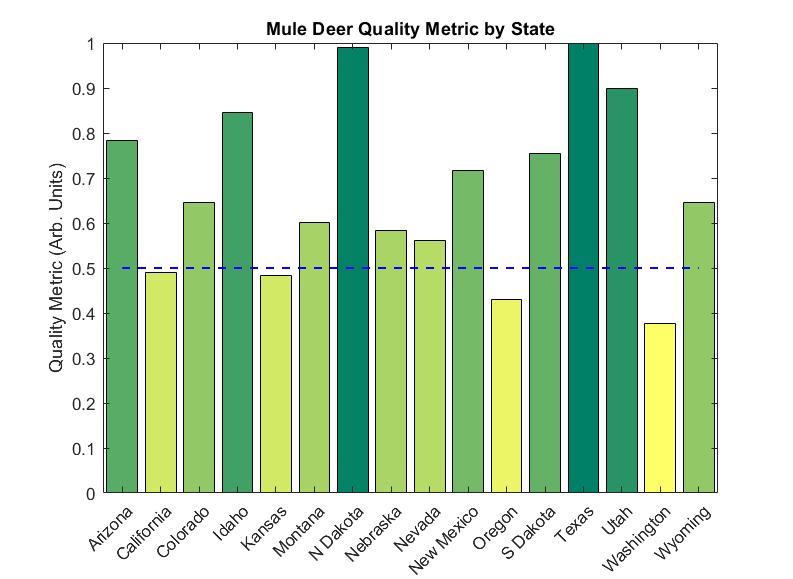
Going a little bit beyond just the abundance of mule deer for each state, I created a Quality Metric based on the data provided by the biologists (see Figure 2). One of the main reasons for doing this was due to the different methods used by state agencies for determining the health and quality of mule deer herds in their respective states. In order to accurately approximate the range-wide relative health, the Quality Metric is based on these parameters:
- Harvest Success Rate
- Population Trend
- B:D Ratio Trend
- Total Population per acre
This provided a state-to-state relative metric that attempts to deconvolve the differences in state wildlife department management techniques since there is not a universal “Gold Standard” in survey techniques. Even though “there is no universal standard between agencies”, as pointed out by Jim Heffelfinger who is the Wildlife Science Coordinator with the Arizona Game and Fish Department and Chair of the Mule Deer Working Group (MDWG), “stakeholders agreed that the currently used survey methods are accurate after Colorado spent over $250,000 on a study showing the best method is comparable to the ones used today.”
Since we can rely on the variance between datasets being minimal due to different survey techniques the abundance data and Quality Metric should be as reliable as we can get our hands-on. Furthermore, to air on the side of caution, I weighted the Quality Metric parameters depending on their relative precision.
Some May Be Surprised
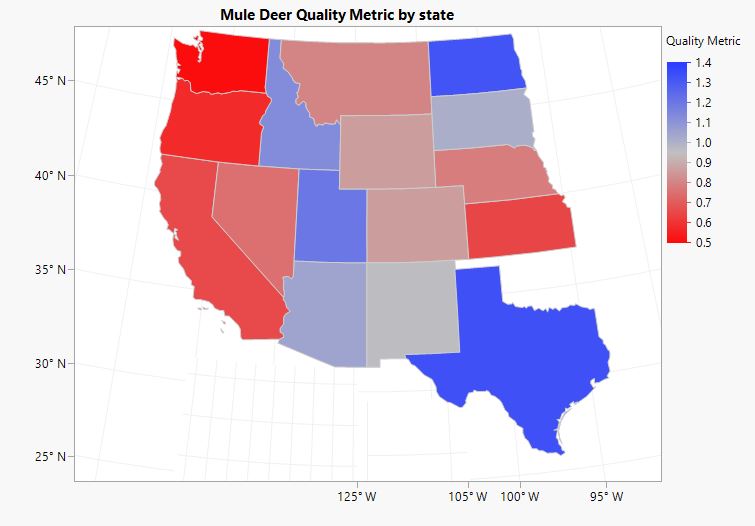
Some key observations from the Quality Metric is the performance of “less” notorious states like North Dakota and Texas, where they both scored very high. This was in large part with the steady increases in both their total population and B:D ratio trends. This is in contrast to their low population per acre (see Figure 1). Utah also performed somewhat surprisingly well while other states like California, Kansas, Oregon, and Washington all came in with the lowest scores (perhaps not surprisingly).
Without going into the mathematical rat-hole, based on the structure of the Quality Metric, I approximated a desirable lower limit that is indicated by the blue dashed line. This represents an approximate threshold a state should (big “should”) score higher than. Of the states that scored higher than this threshold, Colorado and Wyoming did not perform as well as most would probably expect, while Arizona, Idaho, New Mexico, South Dakota, and Utah all scored nicely.
The lower Quality Metric scores for Colorado and Wyoming are in direct contrast to their relatively high abundance as shown in Figure 1. This is due to the steady decline in total populations since 2001 (Colorado) and 1990 (Wyoming). On the other hand, Idaho is a bright spot with healthy population and harvest trends. Jim pointed out perhaps the most notable data point for the health of mule deer in Idaho,
“In Idaho, the percent of bucks harvested that were four-point or better in the rifle hunts has been above 40% in the last decade. In 2019, 63% were four-point or better.”
That is a pretty impressive statistic!
In addition to the bar graph of the Quality Metric (Fig. 2), I overlaid the same Quality Metrics on the map in Figure 3 for illustration. When comparing Figures 1 and 3, this clearly shows that mule deer abundance does not necessarily correlate with the trajectory of the “health” of the species. Absolute mule deer abundance and trajectory can fluctuate for many different reasons and investigating those reasons are beyond the scope of this article. Nevertheless, the map overlays in Figures 1 and 3 conveniently show the geographical mule deer abundance distributions by state and the Quality Metric illustrated in Figure 2 provide a nice summary on the range-wide health of mule deer in the Intermountain West.
Summary
In general, mule deer populations in most western states have been stable or increasing in recent years[2]. Each state’s mule deer populations have tracked differently for a variety of reasons and hunters should investigate the specific states they are interested in. Although most western states have been stable or increasing in recent years, mule deer are still struggling to a degree, as noted by Jim, “Deer populations throughout the West are almost universally below where state agencies would like to see them.”
Even with deer populations below objectives, there isn’t any overwhelming evidence supporting the notion that mule deer populations are the worst they have ever been. The data also doesn’t support that mule deer are on a continual decline, overall.
Comment on this article or ask Mike questions here.
References
- Historical and Current Mule Deer Abundance, Fact Sheet #32, MDWG and WAFWA
- 2020 Range-Wide Status of Black-tailed and Mule Deer, MDWG and WAFWA
Special thanks to Jim Heffelfinger, Wildlife Science Coordinator with the Arizona Game and Fish Department, Chair of the Mule Deer Working Group (MDWG). His book is available here.
If you would like to help manage mule deer beyond license dollars spent, join the Mule Deer Foundation here. License dollars aren’t always enough to ensure a bright future for mule deer. By joining the Mule Deer Foundation, you can make sure the Mule Deer Foundation can continue working for one of our greatest species.


