


Breaking down Colorado’s Big Game Hunt Tables
By Guest Contributor – Kevin Clerkin
A recent post in the mule deer forum here on Rokslide got me thinking about one of my favorite hobbies – breaking down hunt draw odds and statistics. Since most of the websites that were previously providing draw odds have transitioned now to requiring a fee, I decided to put together a short tutorial on deciphering the various big game data tables that Colorado publishes. There is a lot of extra information in these tables that won’t usually come across on a fee based statistic website or in the trophy hunting magazines such as odds of drawing a tag with a second or third choice. This article will focus on the drawing odds and draw statistics for deer, elk, pronghorn, and bear. The data tables and draw process for goat, sheep, and moose are slightly different but once you have the deer/elk/antelope tables mastered, you should be able to decipher the trophy tables without to much trouble.
To start off you will need to go to the Colorado Parks and Wildlife big game statistics website where all of the tables are linked. This page can be found here: CO Hunt Stats
Alternatively you can start at the Colorado Parks & Wildlife homepage and navigate to this information by clicking on hunting -> big game -> statistics.
Once here, you will see a list of links organized by species. The links point to various data tables organized by year. The tables include: Hunt Recap Summaries, Drawing Summaries, Preference Points Required, Estimated Harvest, and Population Estimates. We will focus on the first three tables as they have all the needed information to determine drawing odds.
For the purposes of this article let’s assume that you have already decided what species and weapon you want to focus on, what time of year you want to hunt, and how many preference points you have for that species. Once you have narrowed your choices down by weapon and species bring up the Preference Points Required table for the species you wish to hunt.

The table is not broken down by method of take. You will have to determine hunt type from the hunt codes (or from the CO Big Game Regulations). A typical hunt code will look something like D-M-054-O3-R. The first letter stands for the specie, in this case, D = deer. The second letter, either M, E, or F stands for Male, Either sex, or Female. Next is the unit number (unit 54 in this case), then season number (3rd in this case). Codes ending in A are Archery hunts and those ending in R and M are for Rifle and Muzzleloader respectively. An antlerless-elk, muzzleloader hunt in unit 37 would look like E-F-037-O1-M in the regulations booklet and like EF037O1M in the data tables.
Archery seasons typically run from the end of August until near the end of September. Muzzleloader season usually runs for 8 days starting on the second Saturday in September and overlap the archery hunts. For rifles there are a myriad of season dates from early September high country hunts to late season hunts in December and January. However, the majority of the rifle hunts on public land occur in the 1st, 2nd, 3rd, and 4th season rifle hunts ranging from late October to mid November. The 1st rifle hunt is an elk only season, and the other three are combined deer/elk seasons. Scroll through the table looking at the hunt codes and note any hunt codes that take as many points as you have or less to draw for your residency classification (Resident or Non Resident) for your preferred weapon type.
As you are doing this also keep note of any hunts that can be drawn with zero points that catch your attention. Later we will break down how to find your odds of getting those tags as a second choice. For this article we will are looking at Unit 21 archery deer for a nonresident bowhunter with 6 preference points.
Once you have your list of hunt codes that you want to research you need to bring up the Hunt Recap Summary and the Drawing Summary. Unfortunately you will be bouncing back and forth between these two documents frequently on each hunt code. I like to bring them up side by side on my monitor so I can see both at once.
I start with the draw summary and find the hunt codes that I have flagged for research. From this you can see how many tags were available to residents and nonresidents and how many people put in for them as 1st choice. You can also see the first choice drawing success percentage. Keep in mind this percentage is the simple odds, and really doesn’t mean anything to you if the hunt requires one or more points to draw. This is because Colorado’s preference point system awards tags to the individuals with the most points. Let’s look at the hunt code we identified above, DM021O1A. This is an archery hunt for mule deer bucks in unit 21 that took a minimum of 6 nonresident points to draw in 2012.

As you can see in the Draw Summary table above, there were a total of 80 licenses available in the quota. However, 12 of these licenses were set aside for landowner applications leaving 68 licenses available for the public draw. A total of 395 people put in for these 68 tags (178 residents and 197 non residents). 45 residents and 23 non-residents were successful in drawing the tag. Because there were more 1st choice applications than tags available, nobody drew as their second choice.
Now we need to hop over to the Hunting Recap Report to calculate the odds that we will draw the tag next year with our 6 points. To do this we have to make a couple of assumptions. The first is that the tag quota will stay the same for 2013. The second is that the same people will apply for the hunt code next year. As you know either of these can change from year to year and make your odds better or worse than this method will show. As we saw in the draw summary 23 NR’s drew the tag.

Of these one drew with 15 points, one with 10 points, one with 8 points, seven with 7 points, and thirteen drew with the minimum required 6 points. This leaves 21 applicants with six points that did not draw. They will have 7 points next year (34-13 = 21). I’m sure you can see where this is going. Staying with our assumptions these 21 will draw the tag in 2013 leaving only 2 more licenses for those with 6 points. So if we add our new application into the 22 others that had 5 points last year there will be 23 people putting in for 2 tags, or an 8.7% chance. If you don’t end up drawing the tag in 2013 you should have a very strong chance of drawing it in 2014 with 7 points since you will be one of about 21 people with 7 points that will be applying for the 23 tags.
Our assumptions will be close, but there will be a few high bonus point guys that will jump in and there may be more or less landowner tags alotted. None the less, this is the best we can do with our crystal ball.
So your chances of drawing this tag aren’t looking good for 2013, but you still want to try to hunt archery mule deer in Colorado don’t you? You could apply for an easier to draw hunt or, better yet, there are a lot of archery tags that you can draw as a second choice and still keep your preference points for 2014. Let’s look at how to calculate the second choice drawing odds.
Go back to the Preference Points Required tables and look at the hunts that peak your interest and took zero points to draw. I see that the either-sex, archery deer-tag for unit 43 (DE04301A) took zero points to draw. Now let’s look at the Drawing Summary Report for hunt code DE04301A.
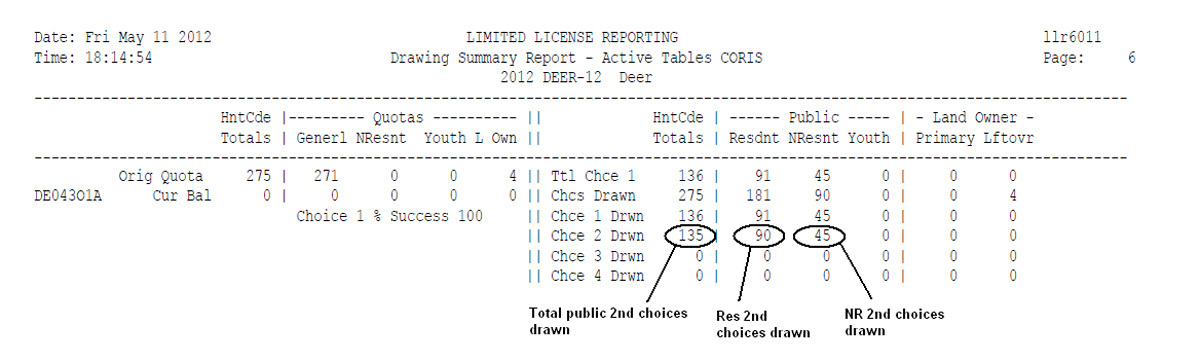

In the draw summary report above you can see that 91 residents and 45 NR’s drew the tag as a second choice for a total of 135 tags. Now open the Hunt Recap Report for 2012 (below) and you will see that 265 people put in for this hunt code as a second choice. The overall odds of drawing second choice would have been 51% (135/265). We can’t calculate the exact odds because we don’t know the breakdown of residents and NR’s that put for the tag as second choice, but this will give you a good idea of the relative draw odds.
Using this information you can determine which units you have a reasonable chance of drawing at your preference point levels. Along with the statistics research, you can take further steps by contacting biologists and hunting buddies, reviewing harvest statistics, population estimates, herd compositions, and even explore the country with Google Earth to help make your choices. It can be a lot of work, but also a lot of fun hunting for the perfect hunt! Good luck in all of your tag draws – we can’t wait to see the full report and your harvest photos here on Rokslide!


